
1. Introduction
Let me describe a scenario that plays out in grocery stores every single day.
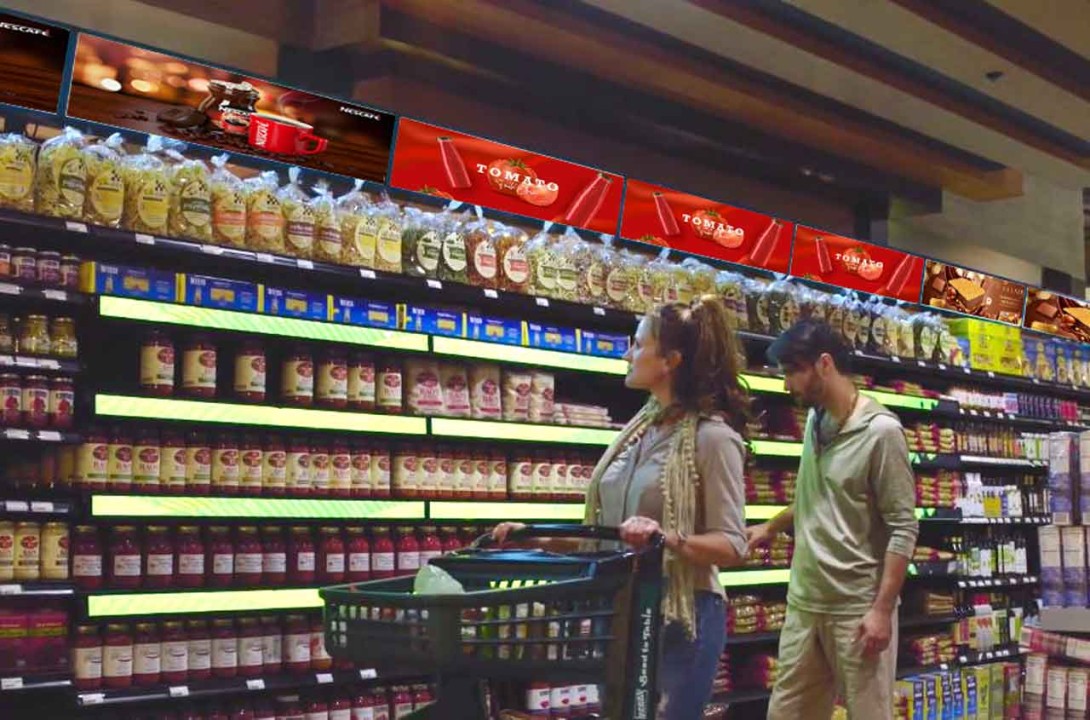
A customer picks up a jar of pasta sauce. She checks the price on the shelf label. $4.29. She puts it in her cart. Two aisles over, another customer picks up the same jar of sauce from a different brand. $3.99. She buys that one instead. The store just lost a higher-margin sale because the pricing strategy was static, uninformed, and reactive.
Now imagine a different scenario.
The same store. The same pasta sauce. But this time, the digital shelf display updates in real time. The system knows that a competing store two blocks away just dropped its price on premium sauce to 3.99.Within minutes, the store′s digital shelf labels adjust. The premium sauce now shows $3.89 – beating the competitor. A promotional tag appears: “Price matched – lowest in town.”
The customer buys the premium sauce. The store wins the sale. The competitor loses.
This is dynamic pricing retail in action. And it is transforming how grocers compete
.
2. What Is Dynamic Pricing for Digital Shelf Displays?
Dynamic pricing retail is the practice of adjusting prices in real time based on market conditions, competitor pricing, inventory levels, demand patterns, or time of day.
When combined with digital shelf display technology (electronic shelf labels or ESLs), dynamic pricing becomes operationally feasible for the first time at scale.
2.1 Traditional Pricing Model (Static)
| Step | Time Required |
|---|---|
| Corporate decides price change | 1 day |
| Print new paper labels | 2-3 days |
| Distribute labels to stores | 2-5 days |
| Store staff replace labels | 1-2 days per store |
| Total time to change one price | 1-2 weeks |
2.2 Dynamic Pricing Model (Digital)
| Step | Time Required |
|---|---|
| System detects price trigger | Seconds |
| Price change approved (automatic or manual) | Seconds to minutes |
| Digital shelf display updates wirelessly | Seconds |
| Total time to change one price | Minutes |
The difference is dramatic. What took 1-2 weeks now takes minutes. This speed enables entirely new pricing strategies.
3. The Core Value Point
Real-time response to competitor price changes and clearance promotions.
Two primary use cases for dynamic pricing in grocery:
| Use Case | Trigger | Action | Expected Outcome |
|---|---|---|---|
| Competitor price matching | Competitor lowers price on identical or similar item | Automatically match or beat competitor price | Retain sales, maintain price perception |
| Inventory clearance | Product approaching sell-by date or overstock situation | Gradually reduce price (e.g., 10%, then 20%, then 30%) | Reduce waste, recover margin before spoilage |
4. Use Case 1: Real-Time Competitor Price Response
Grocery margins are thin – typically 1-3% net profit. Every sale matters. Every lost sale to a competitor matters more.
4.1 How Competitor Monitoring Works
| Step | Description |
|---|---|
| 1. Data collection | Automated web scraping, API integration with competitor pricing data, or third-party price intelligence services |
| 2. Price comparison | System compares your price to competitor price for identical SKUs (same brand, size, packaging) |
| 3. Rule execution | If competitor price < your price by threshold (e.g., $0.10 or 3%), trigger price adjustment |
| 4. Approval (optional) | Automatic adjustment or manager approval (configurable by category, margin, or item) |
| 5. Digital shelf display update | New price pushed to electronic shelf labels instantly |
| 6. Optional customer communication | “Price matched” or “Lowest price guaranteed” messaging on the display |
4.2 Example Competitor Response Rules
| Category | Margin | Competitor Threshold | Action |
|---|---|---|---|
| High-volume staples (milk, eggs, bread) | Low | Match any lower price | Automatic match (retain traffic drivers) |
| Center-store packaged goods | Medium | Match if difference > $0.25 | Automatic match with manager notification |
| Premium/organic | High | Beat if competitor price > 10% below | Manual review (protect brand positioning) |
| Loss leaders (promotional items) | Negative | Do not match (already below cost) | No action |
4.3 Real-World Impact Estimate
| Metric | Without Dynamic Pricing | With Dynamic Pricing | Improvement |
|---|---|---|---|
| Competitor price changes detected per week | 0 (manual detection) | 100+ (automated) | N/A |
| Time to respond to competitor price change | 1-2 weeks | 2-5 minutes | 99%+ reduction |
| Sales lost to competitor on matched items | 15-30% | 5-10% | 50-70% reduction |
| Customer “price perception” (confidence in store pricing) | Moderate | High | Significant improvement |
5. Use Case 2: Dynamic Markdowns for Inventory Clearance
Grocery waste is a massive cost. Perishable goods – produce, meat, dairy, bakery – have limited shelf life. When products approach their sell-by date, the choice is simple: discount them or throw them away.
5.1 Traditional vs. Dynamic Clearance Approach
Traditional Clearance Approach:
| Days Before Sell-By | Typical Markdown | Problem |
|---|---|---|
| 3 days | None | Product sits at full price |
| 2 days | None | Product still at full price |
| 1 day | 30-50% off (manual label change) | Late discount may be too late, or discount is deeper than necessary |
Dynamic Clearance Approach:
| Days Before Sell-By | Dynamic Markdown | Advantage |
|---|---|---|
| 3 days | 10% off | Early discount moves volume earlier |
| 2 days | 20% off (if inventory still high) | Graduated discount matches demand |
| 1 day | 30-40% off (if inventory remains) | Discount only as deep as needed |
| Day of sell-by | 50%+ off (final clearance) | Maximize recovery before spoilage |
5.2 How Dynamic Clearance Works
| Step | Description |
|---|---|
| 1. Inventory tracking | System knows inventory quantity and expiration dates (via WMS or manual entry) |
| 2. Rule configuration | Define markdown schedule by category (e.g., bakery: 10% at 3 days, 20% at 2 days, 40% at 1 day) |
| 3. Automated execution | System adjusts digital shelf display price automatically according to schedule |
| 4. Optional acceleration | If inventory remains high at each stage, discount can deepen faster (demand-based pricing) |
| 5. Clearance flags | Digital shelf display shows “Clearance” or “Save XX%” to attract attention |
5.3 Example Clearance Rules by Category
| Category | Days Before Sell-By | Markdown | Accelerated Markdown (if high inventory) |
|---|---|---|---|
| Bakery (bread, pastries) | 3 days | 10% | 15% |
| 2 days | 20% | 30% | |
| 1 day | 40% | 50% | |
| Produce (berries, leafy greens) | 2 days | 15% | 20% |
| 1 day | 30% | 40% | |
| Day of | 50% | 60% | |
| Meat (fresh chicken, beef) | 2 days | 10% | 15% |
| 1 day | 25% | 30% | |
| Day of | 40% (must sell or freeze) | 50% | |
| Dairy (yogurt, milk) | 5 days | 10% | N/A (longer shelf life) |
| 3 days | 20% | 25% | |
| 1 day | 30% | 40% |
5.4 Real-World Impact Estimate
| Metric | Without Dynamic Pricing | With Dynamic Pricing | Improvement |
|---|---|---|---|
| Shrink (spoilage/waste) as % of sales | 2-5% | 1-2.5% | 40-50% reduction |
| Clearance recovery rate (revenue vs original price) | 30-40% | 50-65% | 50-60% improvement |
| Time to clear overstock (days) | 3-5 days (manual markdown) | 1-2 days (dynamic) | 50-70% reduction |
| Customer response to clearance items | Missed opportunities (late or no signage) | High visibility (digital flags) | Increased sell-through |
6. Beyond Price: What Digital Shelf Displays Can Show
The digital shelf display is not limited to price changes. It can communicate additional information that drives customer decisions.
| Information Element | Example | Business Impact |
|---|---|---|
| Price per unit (unit pricing) | “$0.23 per ounce” | Helps customers compare value; builds trust |
| Promotional flags | “Save $1.00”, “BOGO”, “Price matched” | Increases conversion on promoted items |
| Nutritional highlights | “Low sodium”, “Organic certified”, “Gluten-free” | Supports dietary preferences |
| Sustainability information | “Recyclable packaging”, “Locally sourced” | Appeals to values-driven shoppers |
| QR codes | Link to recipe, product origin, or digital coupon | Extends engagement beyond the shelf |
| Inventory status | “Only 3 left”, “Fresh today” | Creates urgency or freshness perception |
| Dynamic messaging | “Price dropped – was 4.29,now3.89″ | Reinforces value proposition |
7. Technical Infrastructure Required
Implementing dynamic pricing retail with digital shelf displays requires several technology components.
| Component | Function | Vendor Examples |
|---|---|---|
| Electronic shelf labels (ESL) | Display prices and information at shelf edge | SES-imagotag, Pricer, DisplayData, SoluM |
| ESL base station / gateway | Wireless communication to update labels | Same as ESL vendors |
| Price optimization engine | Determines optimal price based on rules and data | In-house or third-party (Revionics, Eversight, xSell) |
| Competitor price data feed | Provides real-time competitor pricing | DataWeave, Profitero, Nielsen, API scraping |
| Inventory management system (WMS) | Tracks stock levels and expiration dates | Existing grocery ERP/WMS |
| Digital signage CMS (for shelf displays) | Manages content and messaging on displays | Varies by ESL vendor |
7.1 Integration Workflow
Competitor price data → Price optimization engine → ESL management system → ESL base station → Digital shelf display → Customer sees updated price
↑ Inventory/WMS data ──────────────────────────────────────────────↑
8. Implementation Considerations for Grocers
8.1 Start with High-Impact Categories
| Category | Why Start Here | Expected ROI |
|---|---|---|
| Center-store staples (cereal, pasta, sauce, canned goods) | High volume, frequent competitor pricing changes | High (sales protection) |
| Perishables (produce, meat, bakery) | High waste, dynamic clearance opportunity | Very high (waste reduction) |
| Dairy and eggs | High traffic, price-sensitive customers | Moderate to high |
| Premium/organic | Higher margins, competitor differentiation | Moderate |
8.2 Pilot Approach
| Phase | Scope | Duration | Success Metrics |
|---|---|---|---|
| Pilot | 1-2 stores, 1-2 categories | 3 months | Waste reduction %, competitor response time, staff feedback |
| Expansion | 5-10 stores, 3-5 categories | 6 months | Sales lift, margin impact, customer satisfaction |
| Full rollout | All stores, all categories | 12-18 months | ROI, shrink reduction, competitive positioning |
9. Common Challenges and Mitigations
| Challenge | Mitigation |
|---|---|
| Competitor data accuracy | Use multiple data sources; implement validation rules; flag suspicious prices for review |
| Customer confusion (prices changing “too often”) | Limit price change frequency for each item; communicate “price matched” or “dynamic pricing” policy |
| Staff training | ESL systems reduce staff workload (no paper label changes); focus training on exception handling |
| Initial investment | ROI from waste reduction alone often justifies investment; calculate payback period (typically 12-24 months) |
| Integration complexity | Choose ESL vendors with open APIs; phase integration by system (start with price optimization, add inventory later) |
| Regulatory compliance (unit pricing, displayed price accuracy) | Ensure ESL system logs all price changes for audit; maintain compliance with local pricing laws |
10. Conclusion
Dynamic pricing retail powered by digital shelf displays is no longer experimental. Major grocers including Carrefour, Ahold Delhaize, Kroger, and Walmart are deploying electronic shelf labels at scale specifically to enable dynamic pricing capabilities.
10.1 The Value Proposition
| Benefit | Expected Impact |
|---|---|
| Retain sales lost to competitors | 5-15% sales protection on matched items |
| Reduce waste from perishables | 40-50% reduction in shrink |
| Improve customer price perception | Higher trust, more frequent visits |
| Enable data-driven pricing decisions | Better margins, higher sell-through |
| Reduce labor cost for price changes | 50-75% reduction in shelf labeling labor |
10.2 Final Recommendations for Grocers
The value point: Real-time response to competitor pricing and inventory-driven clearance promotions is a significant competitive advantage. Grocers who adopt dynamic pricing with digital shelf displays will win sales, reduce waste, and build customer loyalty. Those who do not will lose ground.
My advice for grocers considering this technology:
-
Start with a pilot in high-waste categories (produce, bakery, meat) to prove ROI from shrink reduction
-
Add competitor price matching in high-volume center-store categories once the system is proven
-
Communicate the value to customers: “Lowest price guaranteed” or “Dynamic pricing ensures you pay the best price”
-
Choose ESL vendors with proven integration capabilities and open APIs
The technology is ready. The business case is compelling. The competitive window is open.
Now is the time to implement dynamic pricing with digital shelf displays.